Trading
Trading helps you act on market opportunities through different products, strategies and order types. Learn key trading concepts, technical indicators and risk management methods to make more informed decisions across different markets.
Total Articles
233
Keltner Channel: What It Is and How to Use It
A Keltner Channel is a technical analysis tool retail traders use to in identifying trends, potential reversals and market volatility.
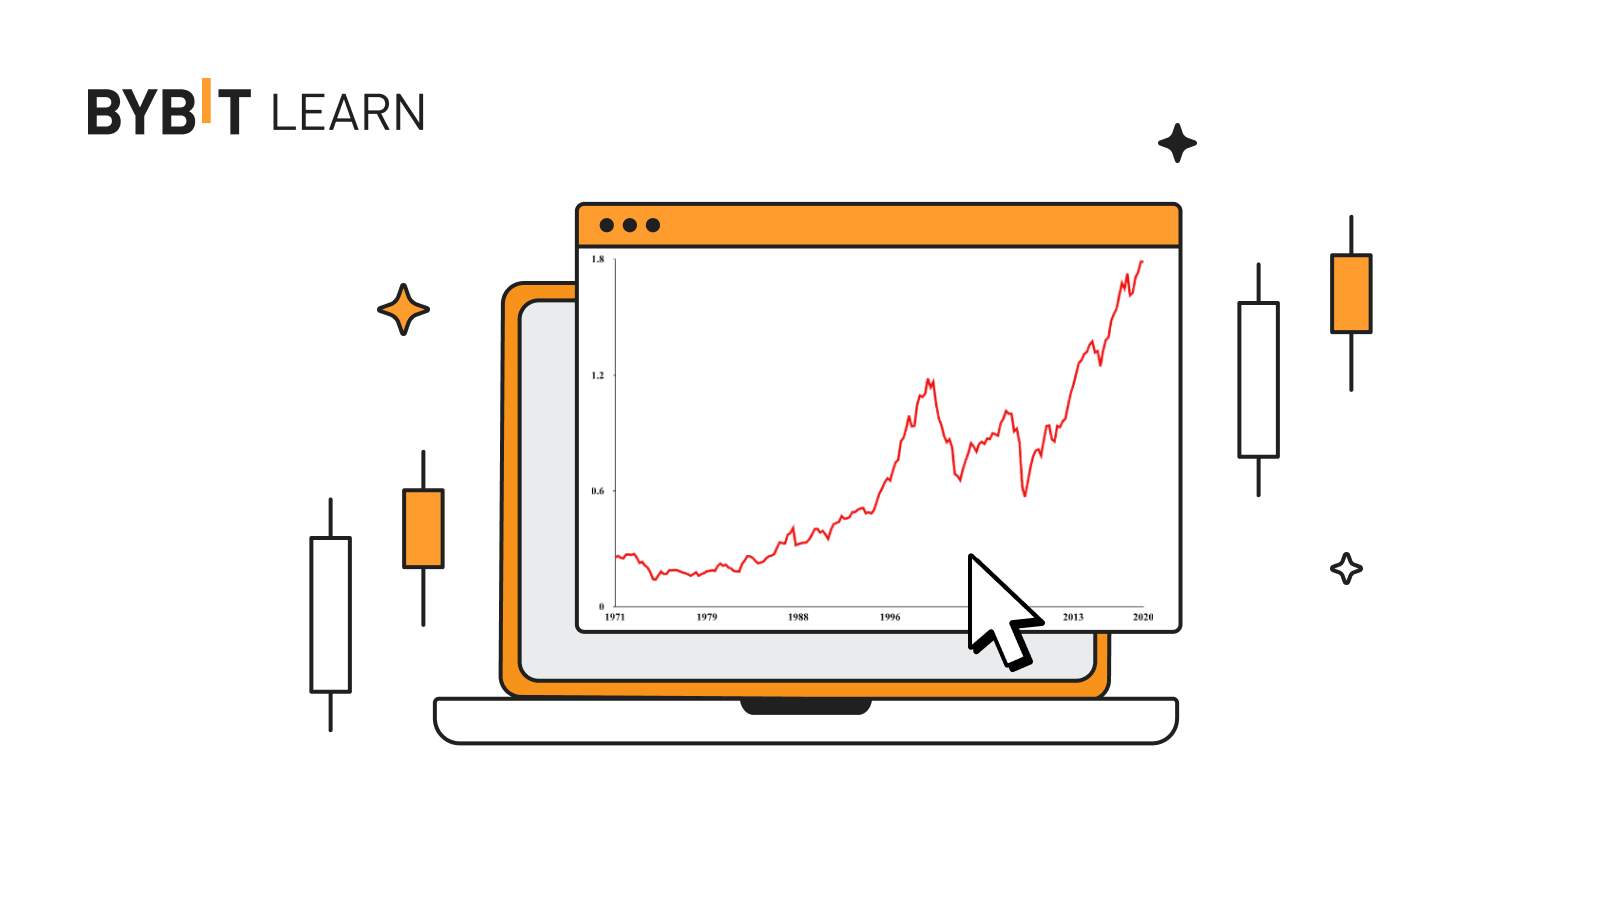
Top 5 Indicators for Timing Entry and Exit Points in Oscillator Trading
Timing is everything when it comes to trading. Learn how to use these indicators in oscillator trading to enter and exit at a prime time.
Weighted Moving Average (WMA): What It Is and How to Use It
Weighted moving average (WMA) is a technical analysis tool that is exceptionally sensitive to short-term market fluctuations as it prioritizes recent data points.
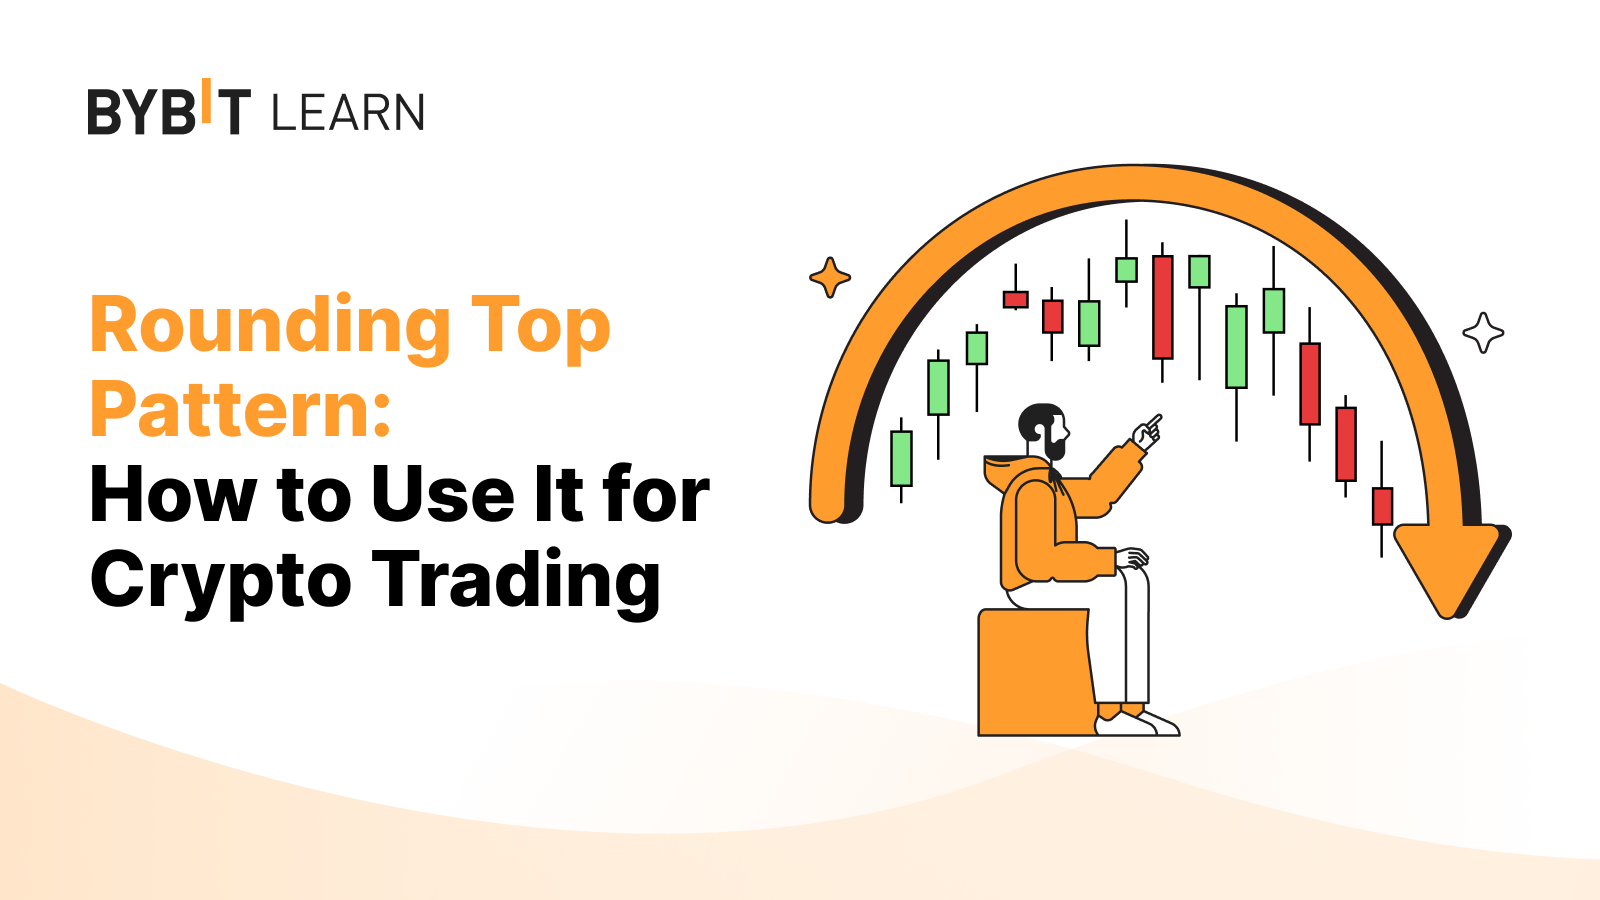
Rounding Top Pattern: How to Use It for Crypto Trading
A rounding top pattern, also known as a rounded top pattern, is a technical analysis tool used by crypto traders to identify a potential trend reversal.
Can the Buffett Indicator Effectively Measure Crypto Market Valuations?
The Buffett Indicator is widely used to determine if the stock market pricing is overvalued or undervalued. But does it apply in the crypto market? Find out now!
How Reliable Is a ChatGPT Trading Strategy?
Can you trade with ChatGPT? We dive right the strategies and find out if it's worth trading with an AI bot.
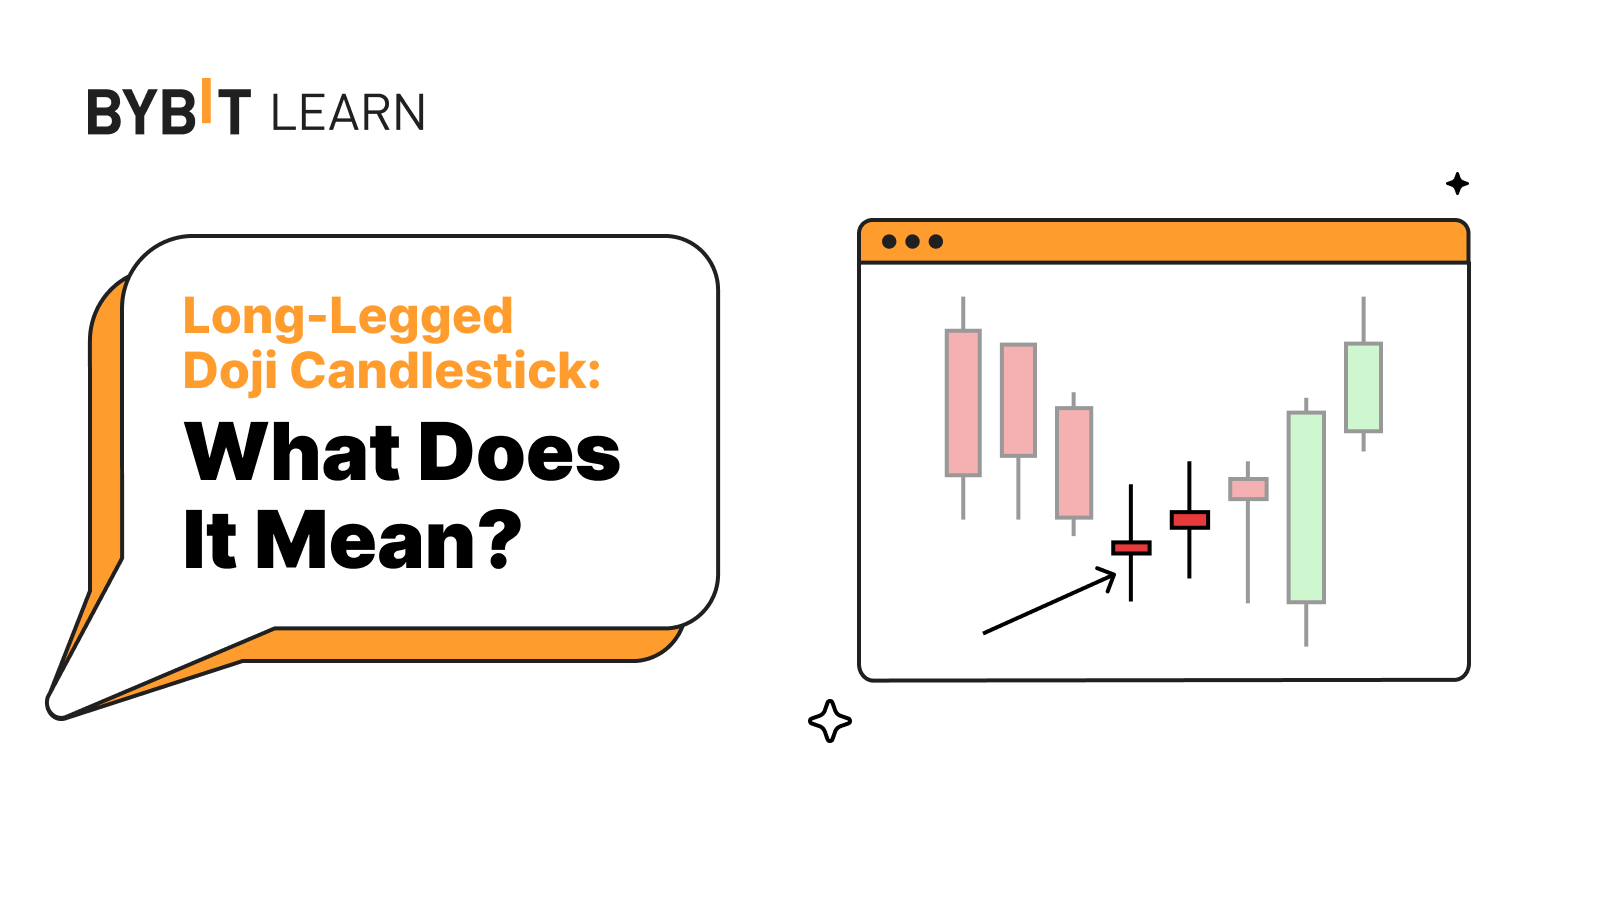
Long-Legged Doji Candlestick: What Does It Mean?
The long-legged doji is a single-bar Japanese candlestick pattern that signals market indecision. It consists of a small body situated between long upper and lower shadows (or wicks).
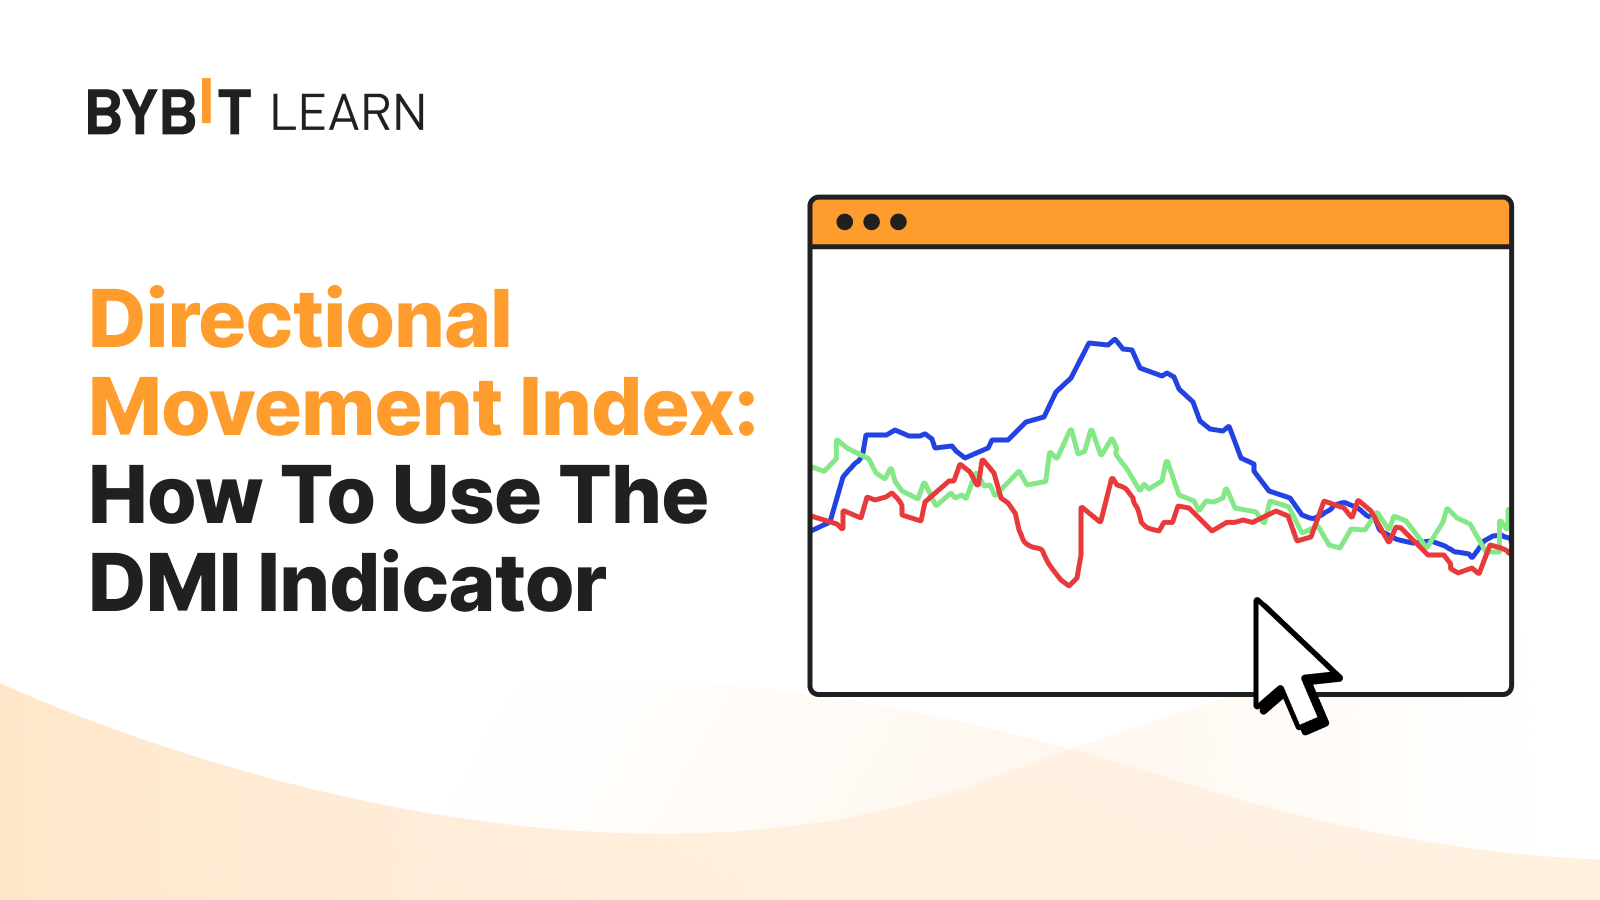
Directional Movement Index: How to Use the DMI Indicator
The directional movement index (DMI) is a widely used technical indicator in financial markets for assessing trend direction and strength.
Simple Moving Average (SMA): What It Is and How to Use It
Simple moving average calculates the average price of an asset over a specified period, providing an average and fair value for it.
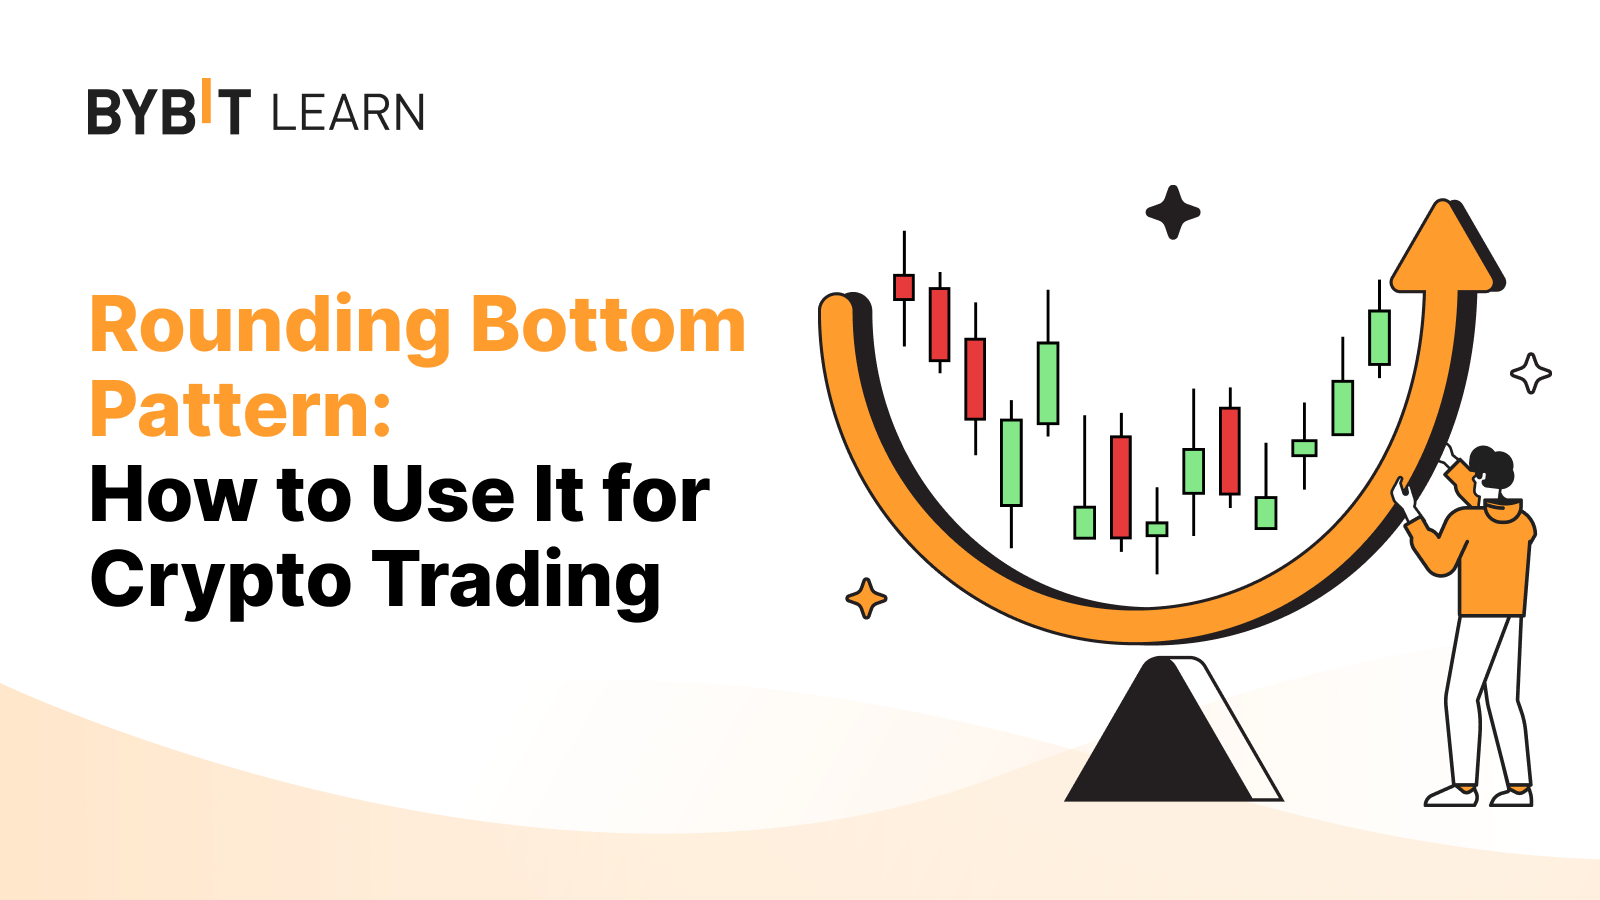
Rounding Bottom Pattern: How to Use It for Crypto Trading
A rounding bottom pattern is a technical analysis trading strategy used to identify potential reversal points in an asset’s price. Find out how it works here.
Learn to get up to 80 USDT prize
Master crypto concepts, trade and earn from your expertise.

Your crypto growth roadmap
View All
Explorer
Lv.0
Practitioner
Lv.1
Specialist
Lv.2
Strategist
Lv.3