Trading
Trading helps you act on market opportunities through different products, strategies and order types. Learn key trading concepts, technical indicators and risk management methods to make more informed decisions across different markets.
Total Articles
233
How to Use Bullish and Bearish Harami Candles to Find Trend Reversals
The Harami candlestick formation is used to signal traders a trend reversal is approaching. Not only is it easy to be spotted, but it also yields a good risk-to-reward ratio. Learn more.
Falling and Rising Three Methods: How to Enter and Exit the Market
The rising three methods and falling three methods help traders to predict market cycles. Learn how to maximize your gains with them.

Stop Hunting: How to Avoid Being Stop Hunted by “Whales”
Stop hunting can be frustrating for the average trader. Learn how to effectively avoid it and protect your virtual assets.

How to Use Shooting Star Candlestick Pattern to Find Trend Reversals
A shooting star is a bearish reversal candlestick pattern with an extended upper shadow with a little lower shadow. It appears to signal traders a trend reversal is coming. Learn how it works.
How to Use Three White Soldiers Pattern to Spot Bullish Reversal?
The three white soldiers is a bullish candlestick pattern that helps traders predict the upcoming trend reversal of a current downtrend. Read on to learn how it works & if it's reliable for technical analysis.

What Is a Heikin-Ashi Chart and How to Trade with It
Heikin-Ashi shares some characteristics with standard candlestick charts. Still, it's different. But how does it work & is it beneficial?

How to Use True Strength Index Indicator to Trade Crypto
The true strength index (TSI) is a momentum oscillator to determine the strength and momentum of a market's trend. We show you how to utilize TSI to identify if trend reversals are approaching.
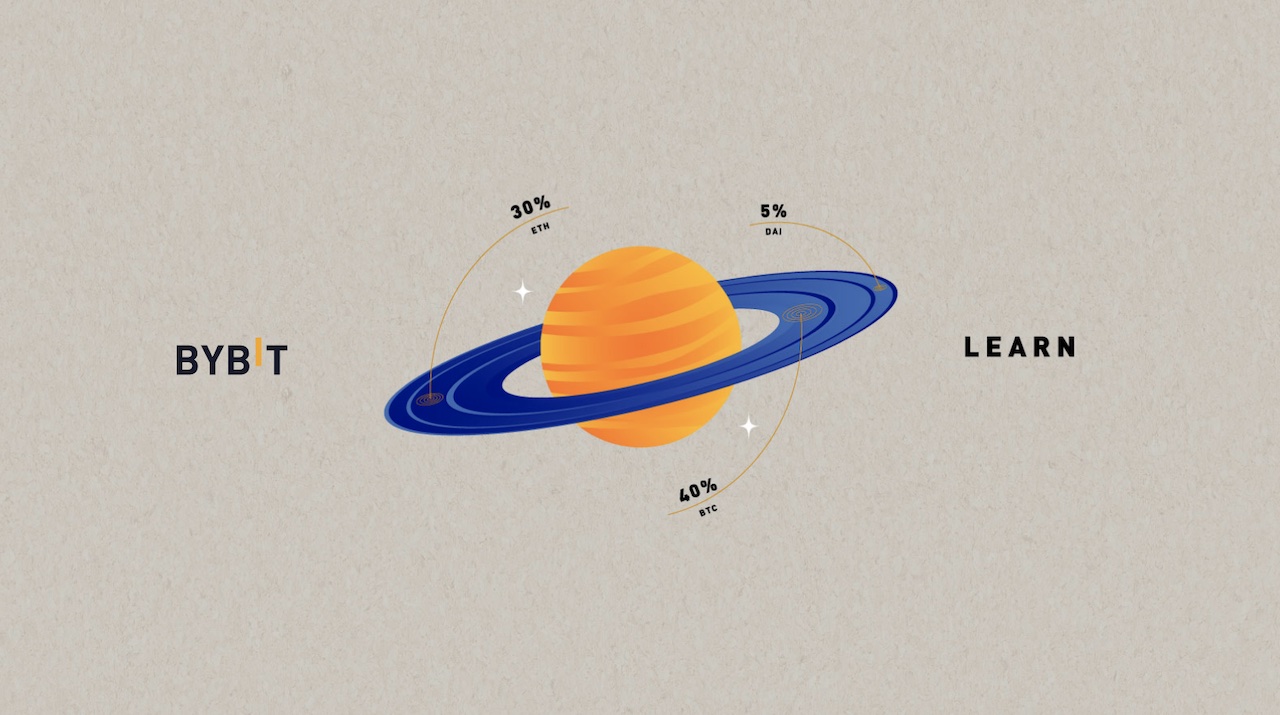
How to Rebalance a Cryptocurrency Portfolio Effectively
Strategic crypto portfolio rebalancing helps you to achieve a desired predetermined investment allocation or risk-reward ratio. Learn how to combat the psychology of holding onto the winners to limit volatility.

How to Use Hanging Man Candlestick Pattern to Trade Trend Reversal
The Hanging Man pattern is a bearish candlestick indicating the bull momentum is losing, signaling a trend reversal is approaching. Learn how to react when hanging man appears.
How to Use Supertrend Indicator to Day Trade Crypto
The Supertrend indicator works well in the trending market to help traders spot buy or sell signals when a reversal is underway. But it could generate false signals too. Learn how it works.
Learn to get up to 80 USDT prize
Master crypto concepts, trade and earn from your expertise.

Your crypto growth roadmap
View All
Explorer
Lv.0
Practitioner
Lv.1
Specialist
Lv.2
Strategist
Lv.3