Candlestick
Each candlestick pattern represents an aggregation of an asset's traded price over a given time. Understanding these patterns gives you an edge in identifying an asset's performance and reliability — and, ultimately, adjusting your trading strategies for maximum profit. Learn these candlestick patterns and techniques today.
Total Articles
35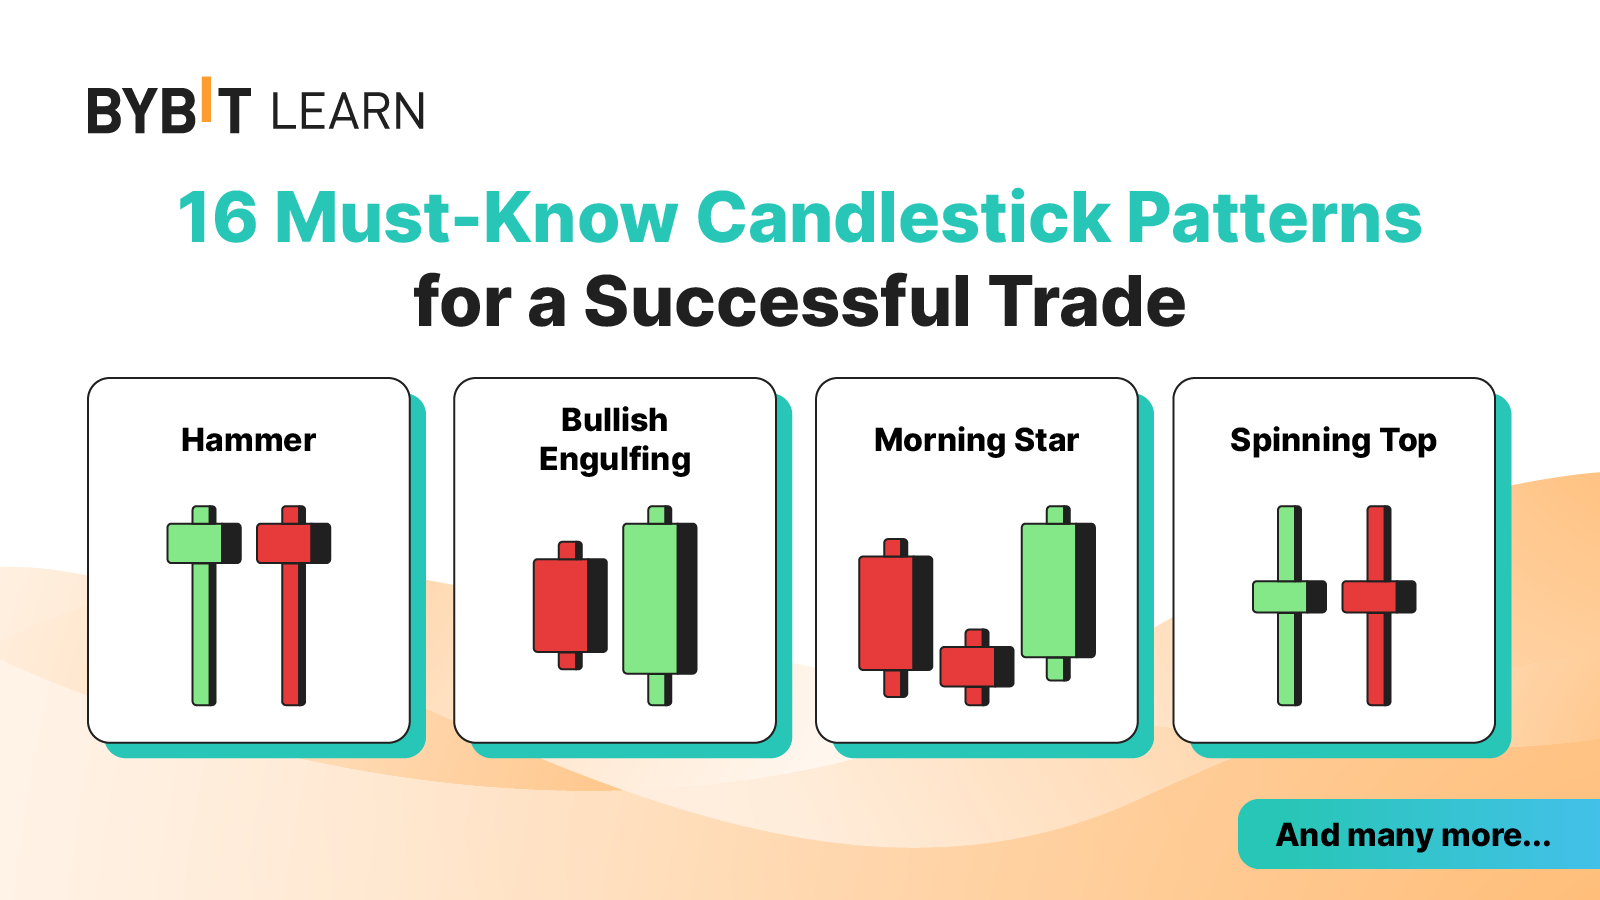
16 Must-Know Candlestick Patterns for a Successful Trade
Candlestick patterns can determine the success or failure in trades in crypto trading. Master these patterns & seize the chance for profits!
View Details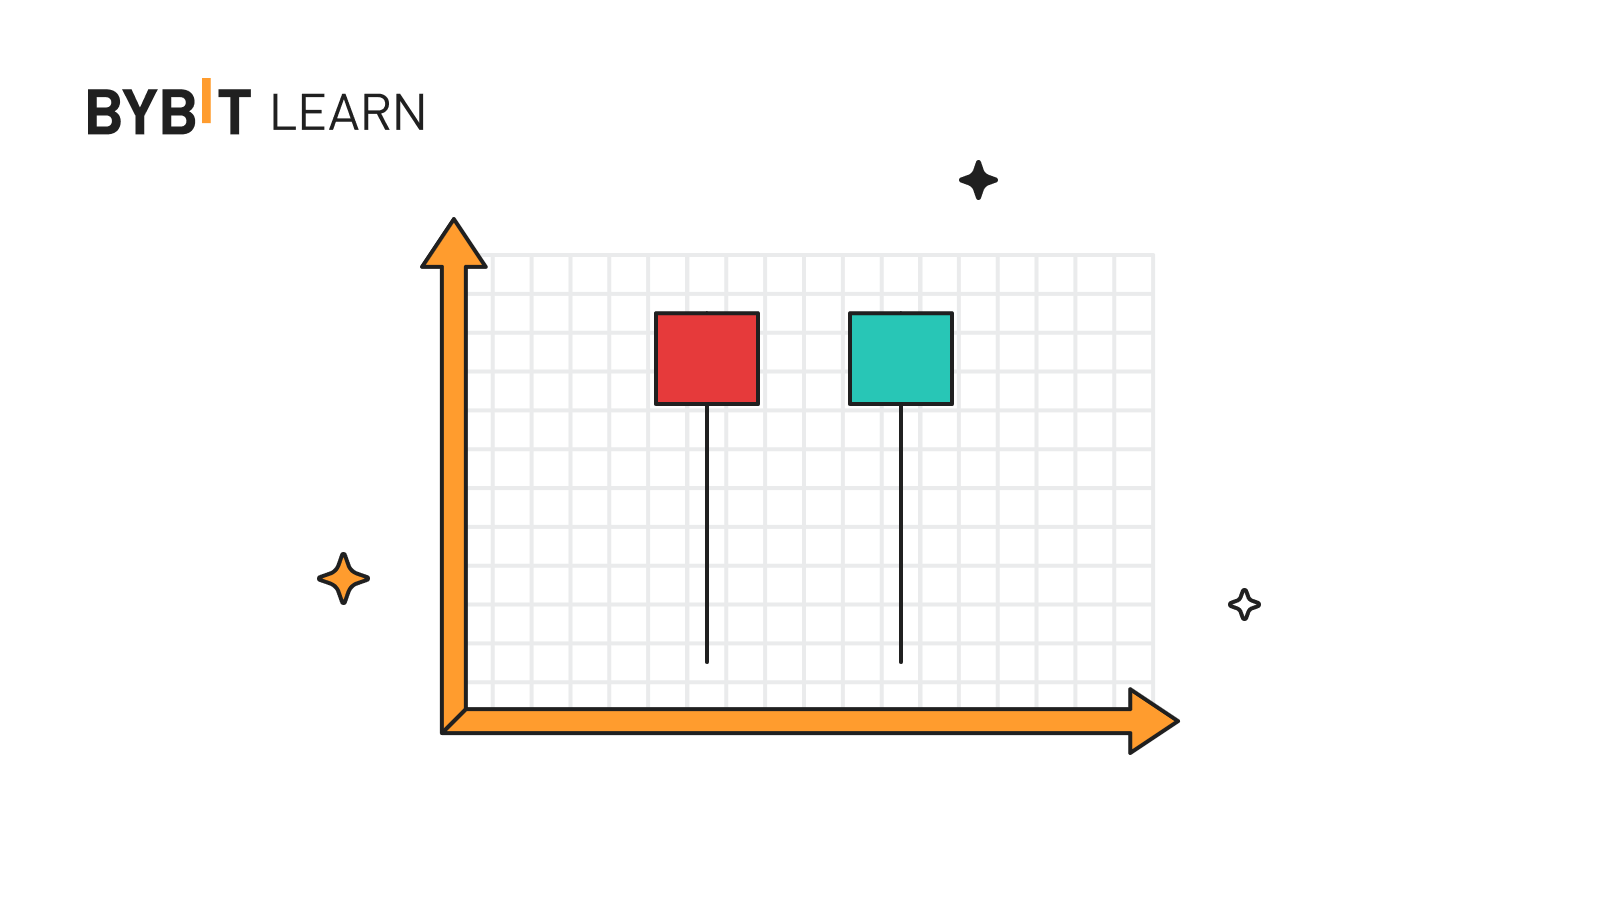
Hammer Candlestick: What It Is and How to Spot Crypto Trend Reversals
Hammer candlestick is a bullish reversal pattern indicating the bear is coming. It occurs when the asset's price decline and is trading lower than the opening price level. Learn how it works.
View Details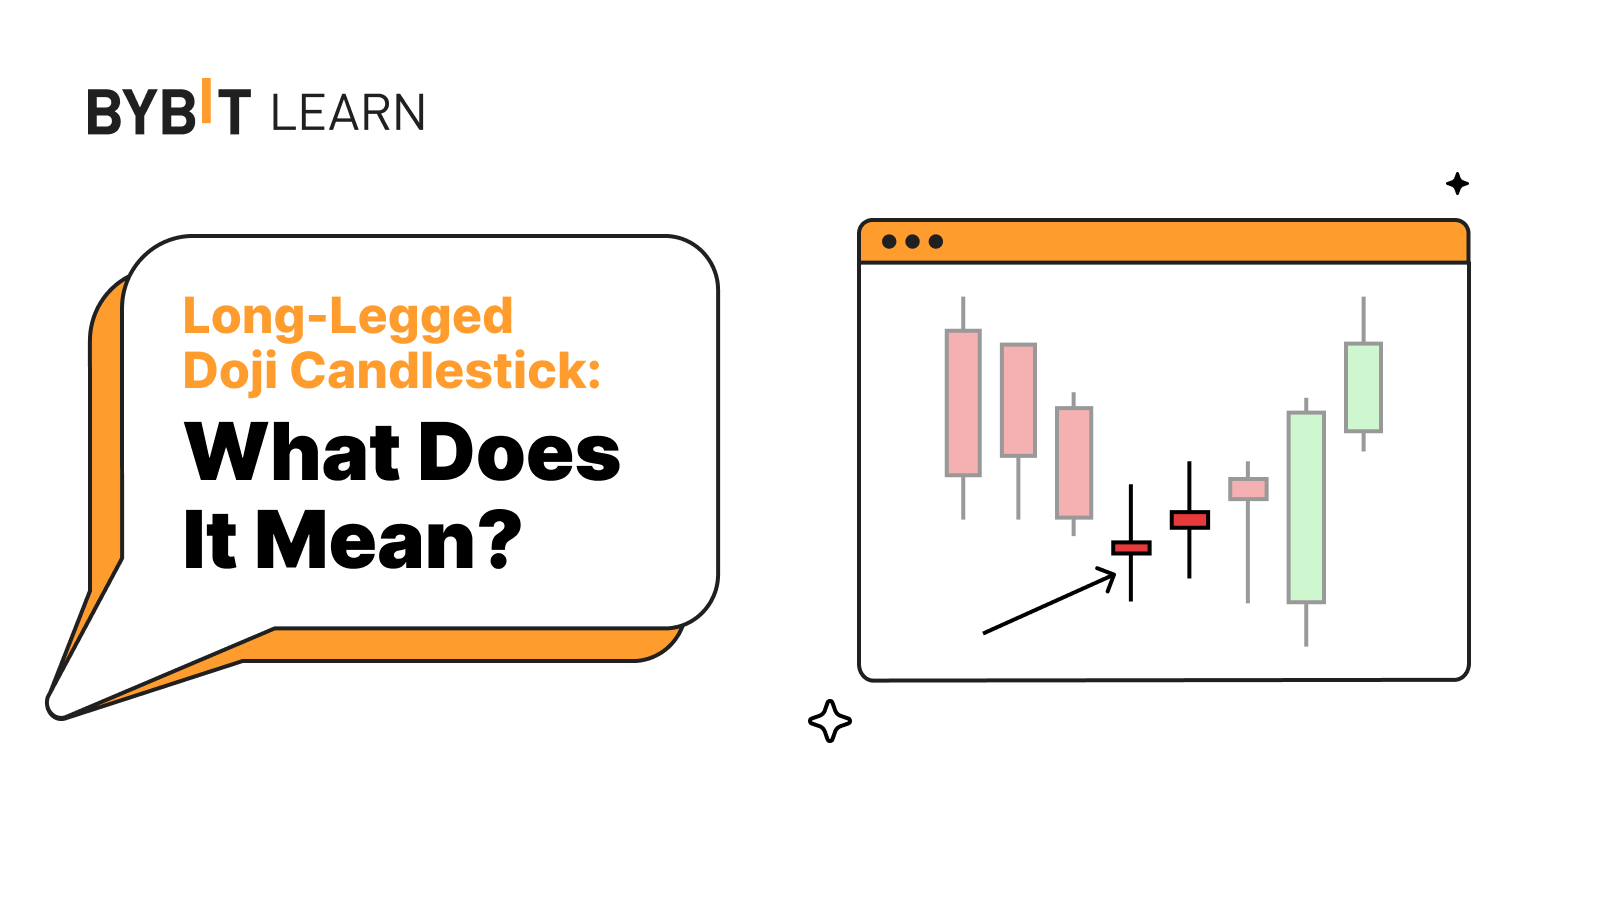
Long-Legged Doji Candlestick: What Does It Mean?
The long-legged doji is a single-bar Japanese candlestick pattern that signals market indecision. It consists of a small body situated between long upper and lower shadows (or wicks).
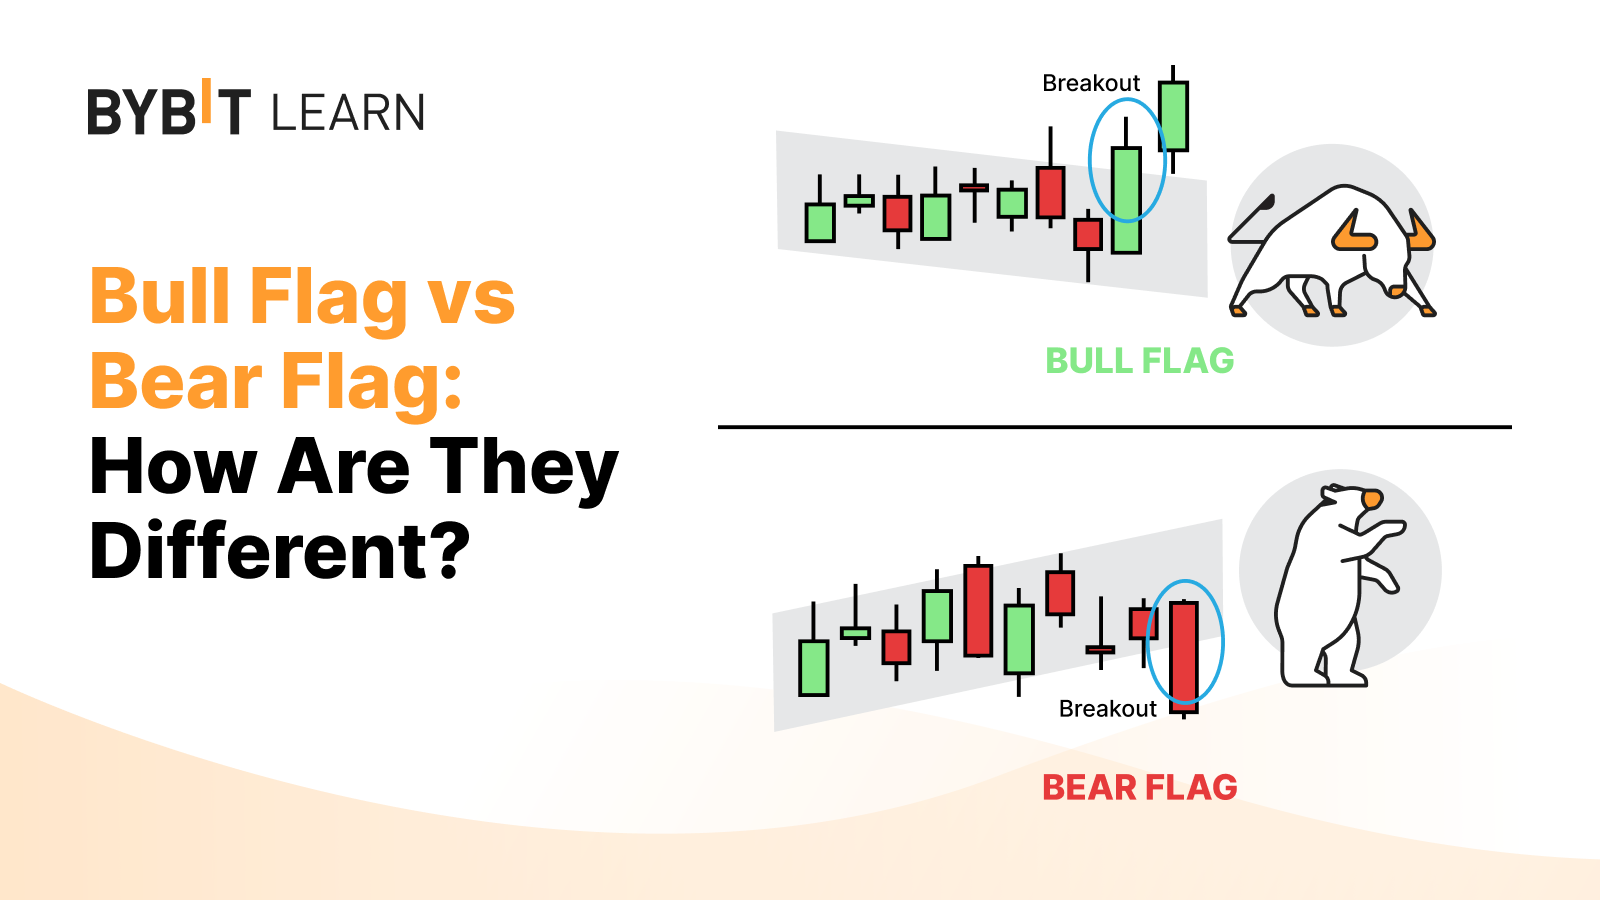
Bull Flag vs. Bear Flag: How Are They Different?
Learn to distinguish a bull flag and bear flag chart pattern by spotting the direction of the pole, and expect a breakout in the direction of the pole's trend.

Pin Bar Strategy Mastery: Unlocking Market Opportunities
Also known as a Pinocchio Bar, pin bar is a reversal pattern characterized by a single candlestick with a long tail or wick and a small body.
Bull Pennant Pattern: How to Trade With a Bullish Pennant
A bull pennant is a chart trading continuation pattern in which, after a strong trend higher, prices pause and consolidate briefly, then rally further, resuming the larger uptrend.
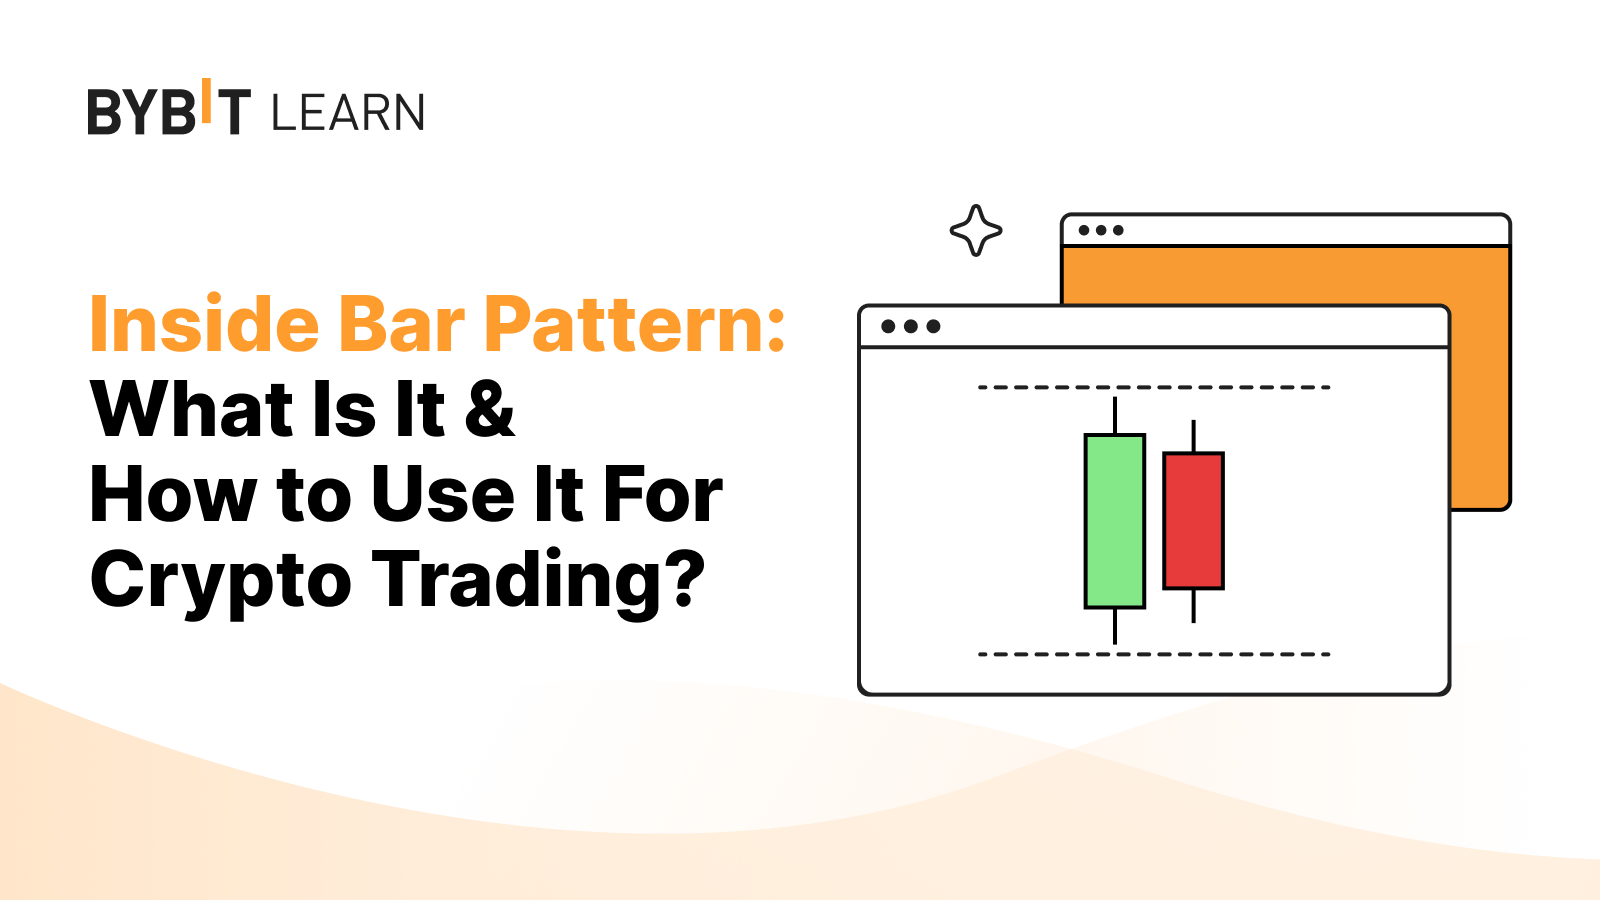
Inside Bar Pattern: What It Is & How to Use It for Crypto Trading
An inside bar pattern is a two-bar price action pattern in which the second bar is completely engulfed or covered by the first bar of the pattern.
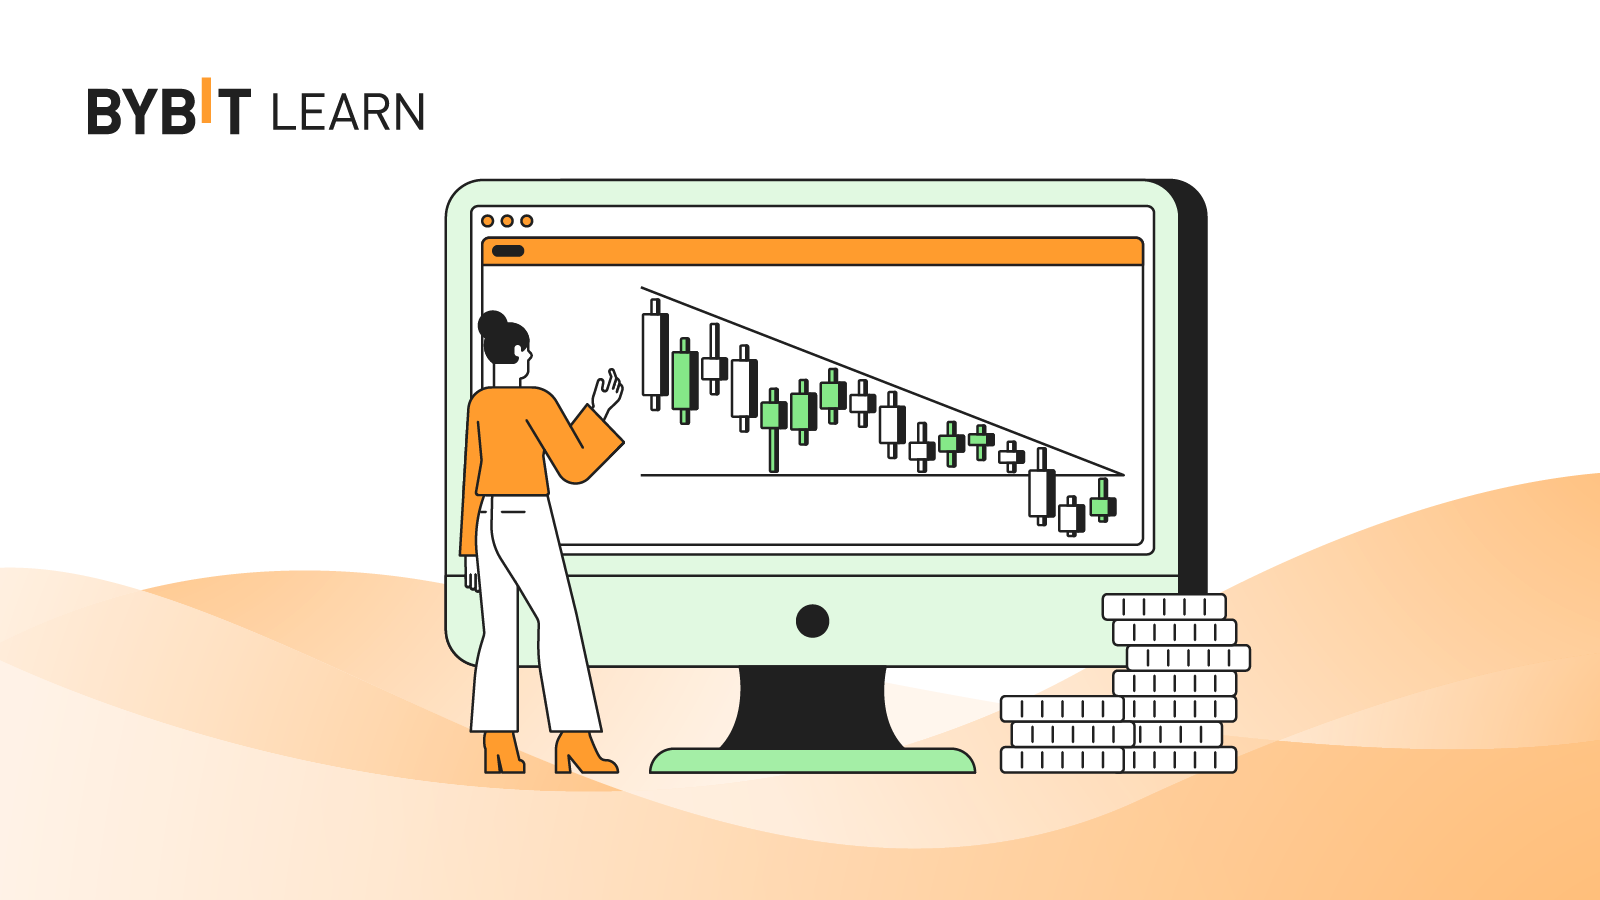
Descending Triangle Pattern: What It Is & How to Use It for Crypto Trading
The descending triangle pattern is a bearish chart formation used in technical analysis to identify potential downward price movements.

Symmetrical Triangle Pattern: What It Is & How to Use It for Crypto Trading
A symmetrical triangle is a neutral pattern with two converging trend lines on the border of the pattern. Traders use it to identify entry and exit points.

Pennant Chart Pattern: What Is It & How to Use It For Crypto Trading?
The pennant chart pattern is a trend continuation pattern that forms in the middle of a price move following a sharp advance of trend. It can occur in both bullish and bearish markets.
Learn to get up to 80 USDT prize
Master crypto concepts, trade and earn from your expertise.

Your crypto growth roadmap
View All
Explorer
Lv.0
Practitioner
Lv.1
Specialist
Lv.2
Strategist
Lv.3