Candlestick
Each candlestick pattern represents an aggregation of an asset's traded price over a given time. Understanding these patterns gives you an edge in identifying an asset's performance and reliability — and, ultimately, adjusting your trading strategies for maximum profit. Learn these candlestick patterns and techniques today.
Total Articles
35
How to Use a Bullish Engulfing Candle to Trade Entries
Bullish engulfing candle signal traders an upcoming reversal in price trends. Learn how to trade strategically with these signals today.

Cup and Handle Chart Pattern: How To Use It in Crypto Trading
The cup and handle chart pattern indicates a bullish trend and makes buying opportunities easy to spot. But is this pattern reliable? Learn more.

Ascending Triangle Pattern: What Is It & How to Use It For Crypto Trading
The ascending triangle, also known as the rising triangle, is a continuation pattern that occurs within a trend. It is a bullish chart pattern and is primarily watched for in uptrends.

Evening Star Pattern: How to Identify a Bearish Reversal in Crypto
Keen on timing your exit from the volatile crypto market? Learn how to use evening star patterns to easily identify bearish reversals.
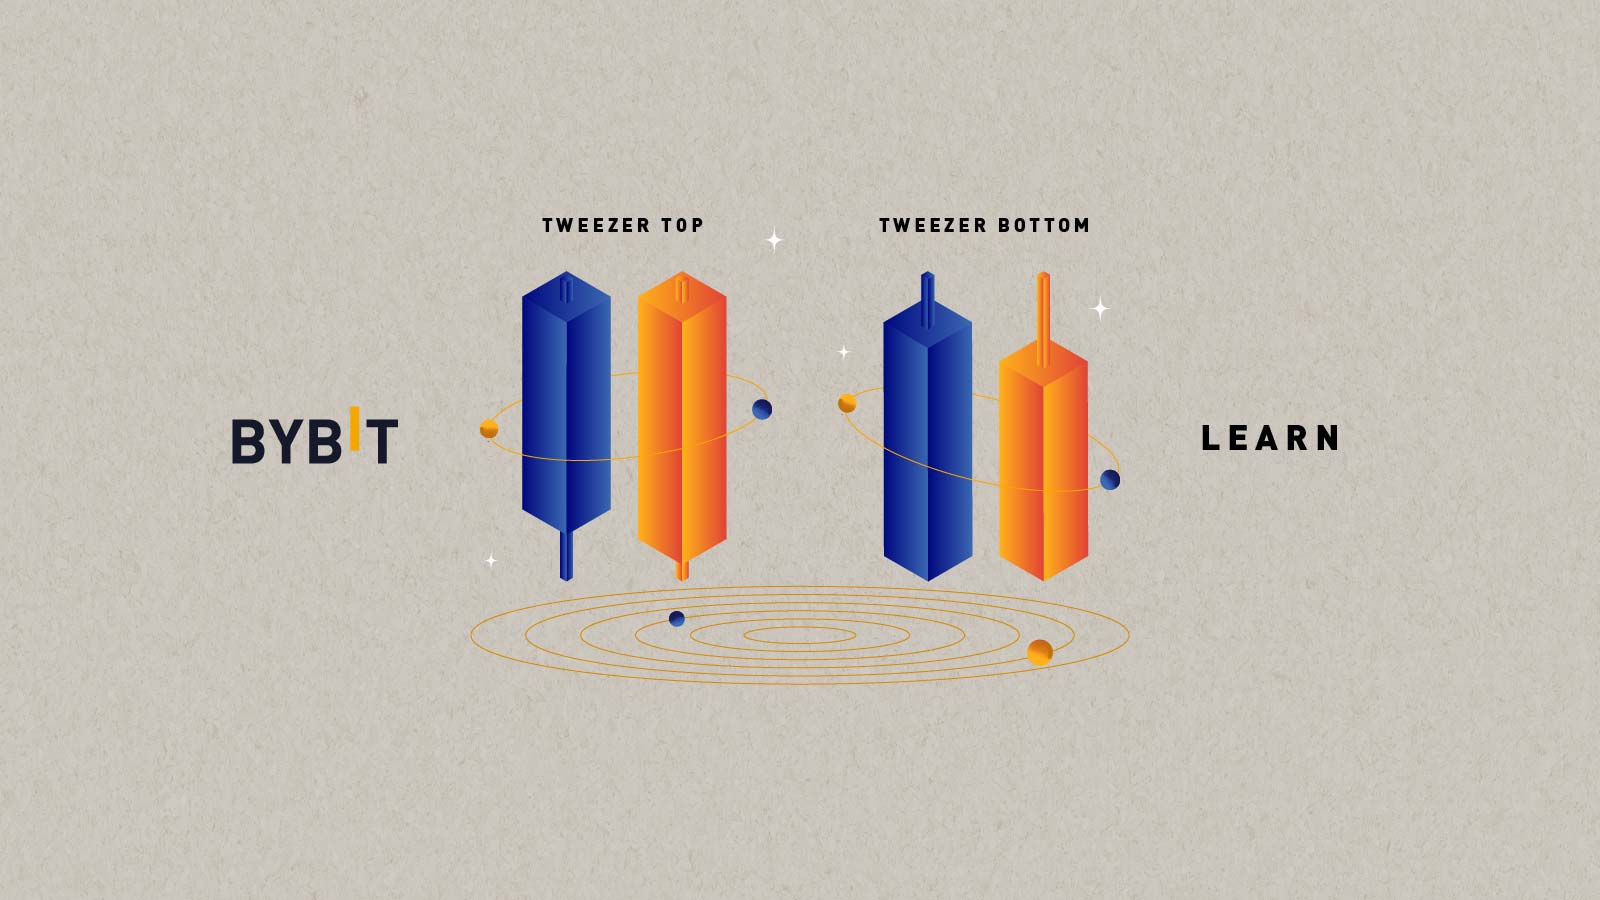
Trading Tweezer Top and Bottom Candlestick Patterns in Crypto
Learn how to trade crypto by identifying trend reversal patterns like tweezer top and bottom candlestick patterns.
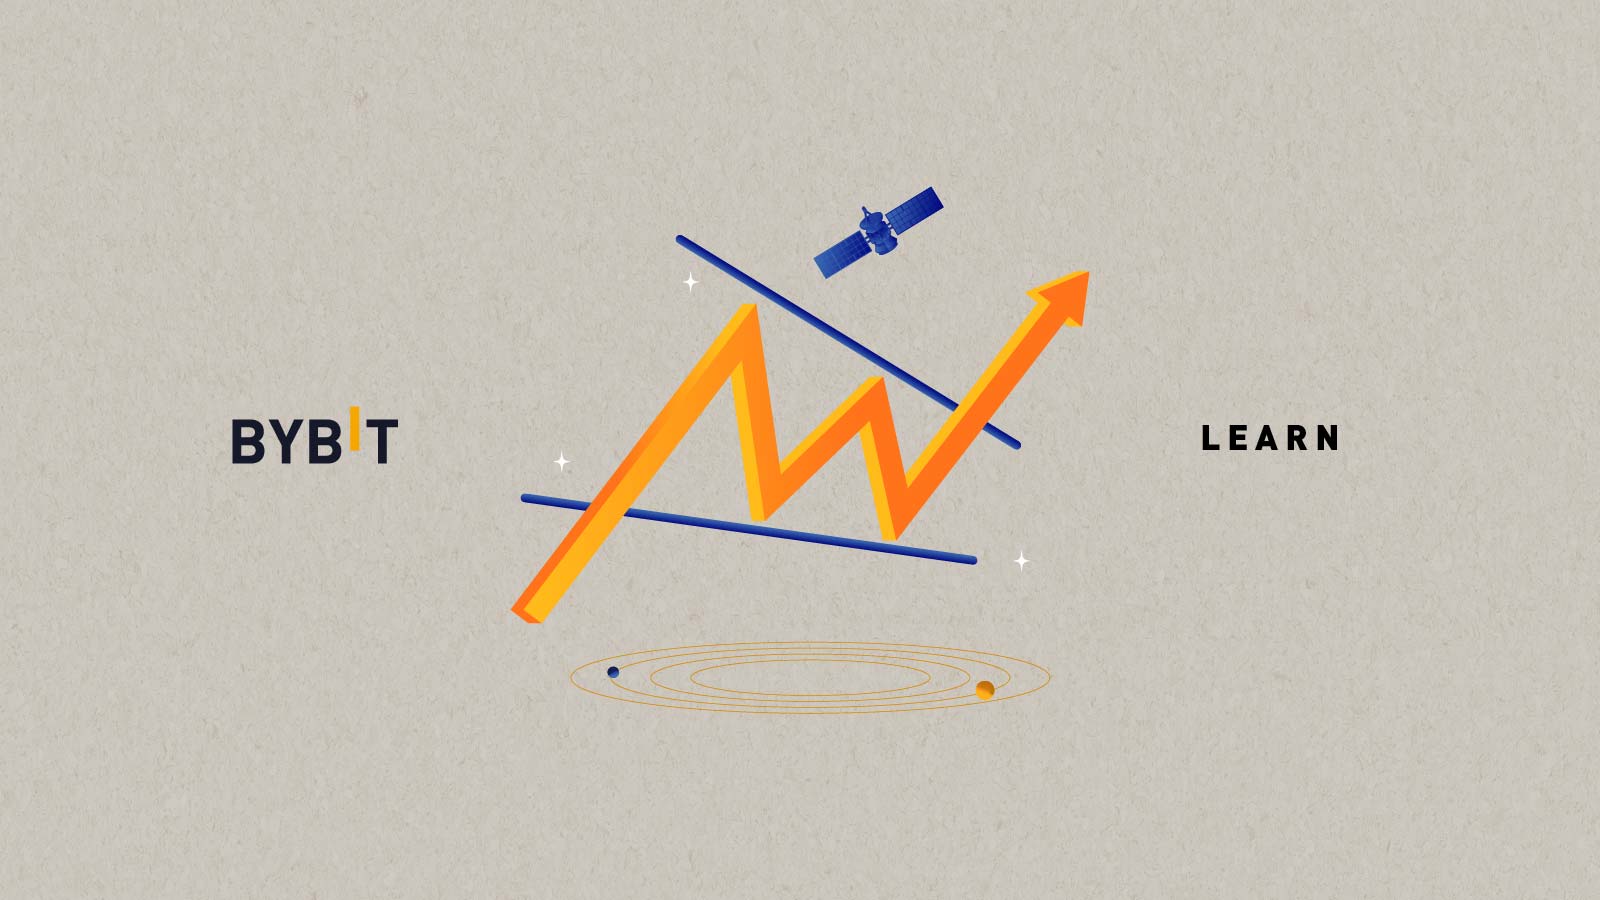
Falling Wedge Patterns: How to Profit from Slowing Bearish Momentum
Is the crypto sell off slowing down? Look out for bullish reversals by including falling wedge patterns in your trading arsenal.

How to Use Marubozu Candlestick Pattern to Predict the Trend Direction
Marubozu candlestick is a lesser-known technical indicator. But did you know it is effective to predict the future price direction of an asset?
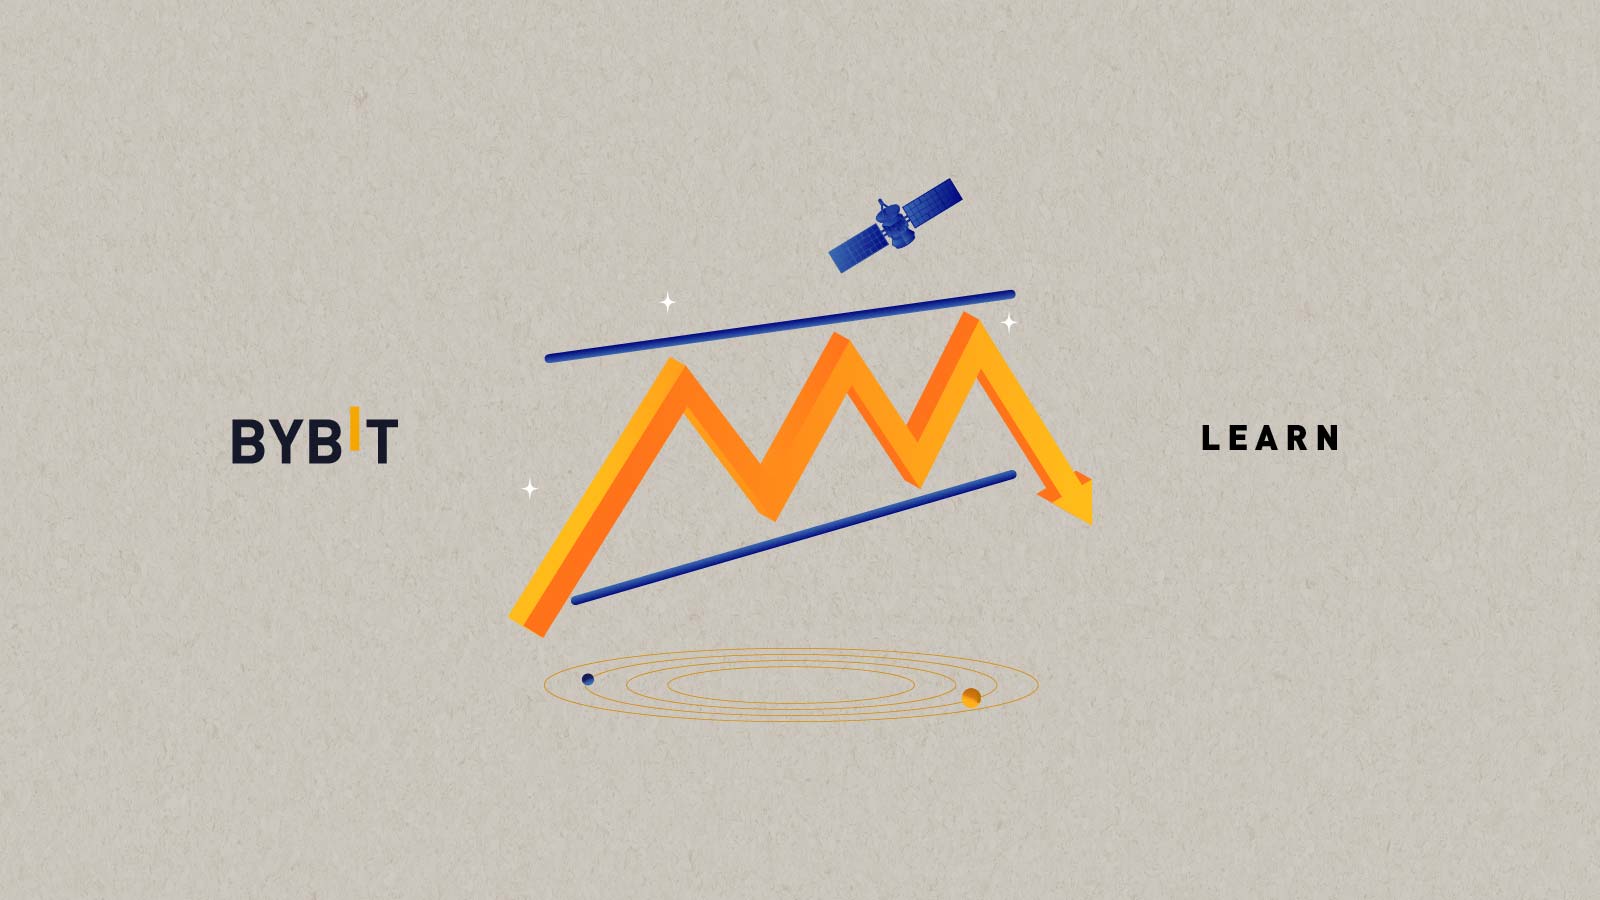
What Are Triple Top and Bottom Patterns in Crypto Trading?
A triple top and bottom chart pattern are rare but powerful formations that signal an upcoming reversal in trend. Learn how to spot these patterns to secure the winning trades.
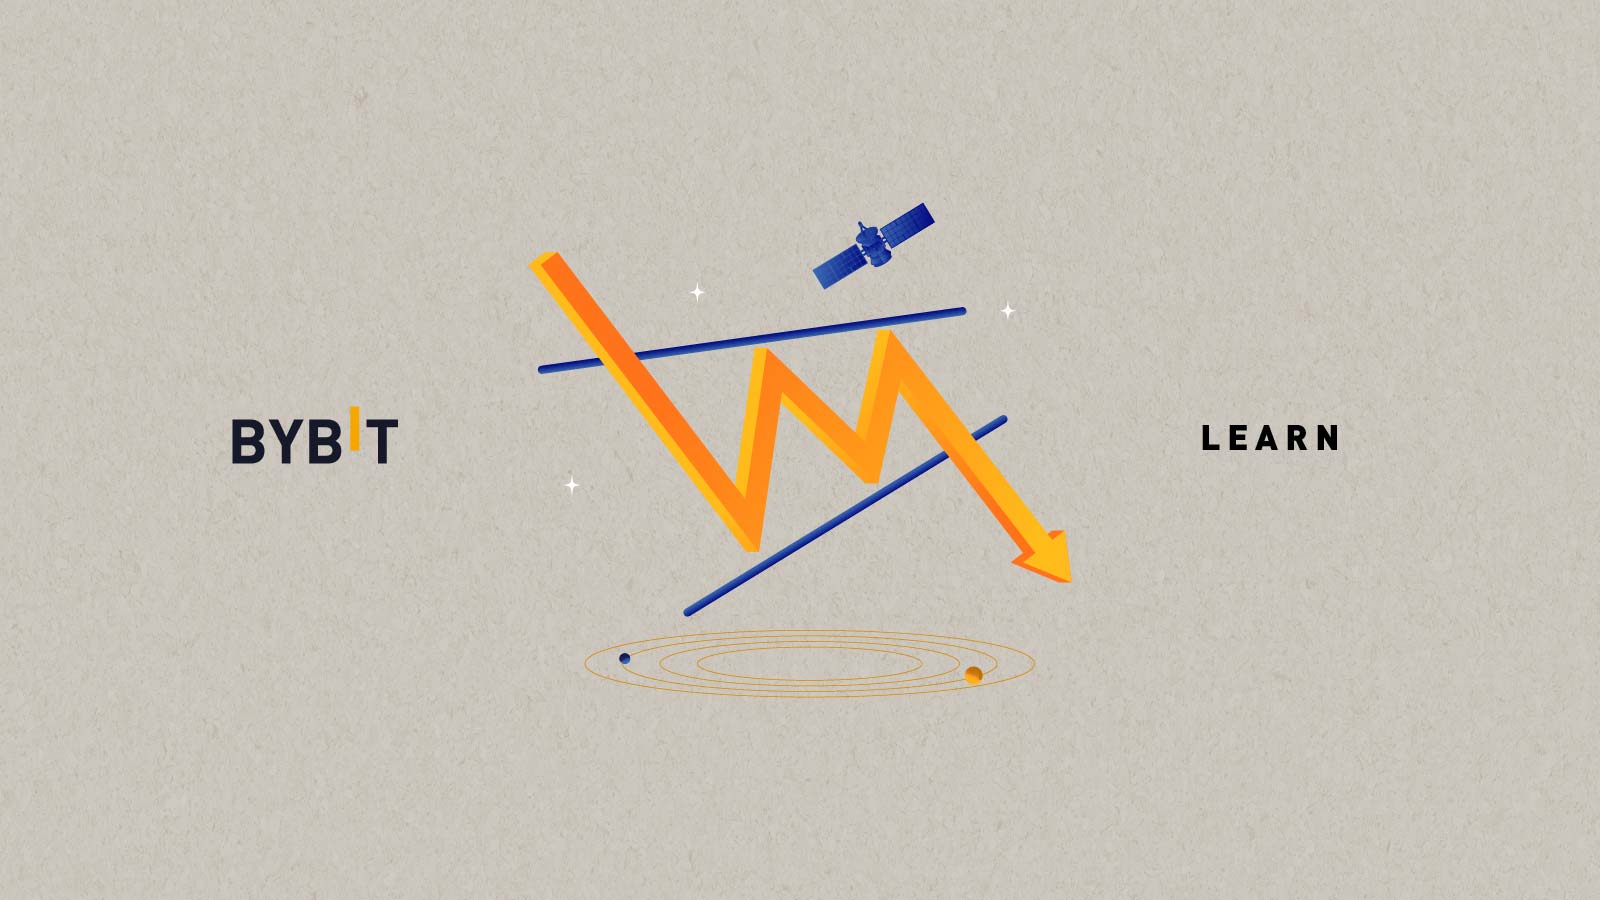
Rising Wedge Pattern: How to Identify a Selling Opportunity
A rising wedge signals a future falling price or a breakout to a downtrend is approaching. But is it reliable? Master how it works in 10 mins!

Bear Pennant: How to Trade with a Bearish Chart Pattern
As a continuation pattern, a bear pennant indicates an extension of a strong downtrend. Learn how to spot the pattern and trade with it.
Learn to get up to 80 USDT prize
Master crypto concepts, trade and earn from your expertise.

Your crypto growth roadmap
View All
Explorer
Lv.0
Practitioner
Lv.1
Specialist
Lv.2
Strategist
Lv.3