Candlestick
Each candlestick pattern represents an aggregation of an asset's traded price over a given time. Understanding these patterns gives you an edge in identifying an asset's performance and reliability — and, ultimately, adjusting your trading strategies for maximum profit. Learn these candlestick patterns and techniques today.
Total Articles
35
How To Use Spinning Top Candle Patterns To Identify Trend Reversals
Keen on buying off potential trend reversals? Why not use spinning top candle patterns and learn to recognize reversals with our guide!
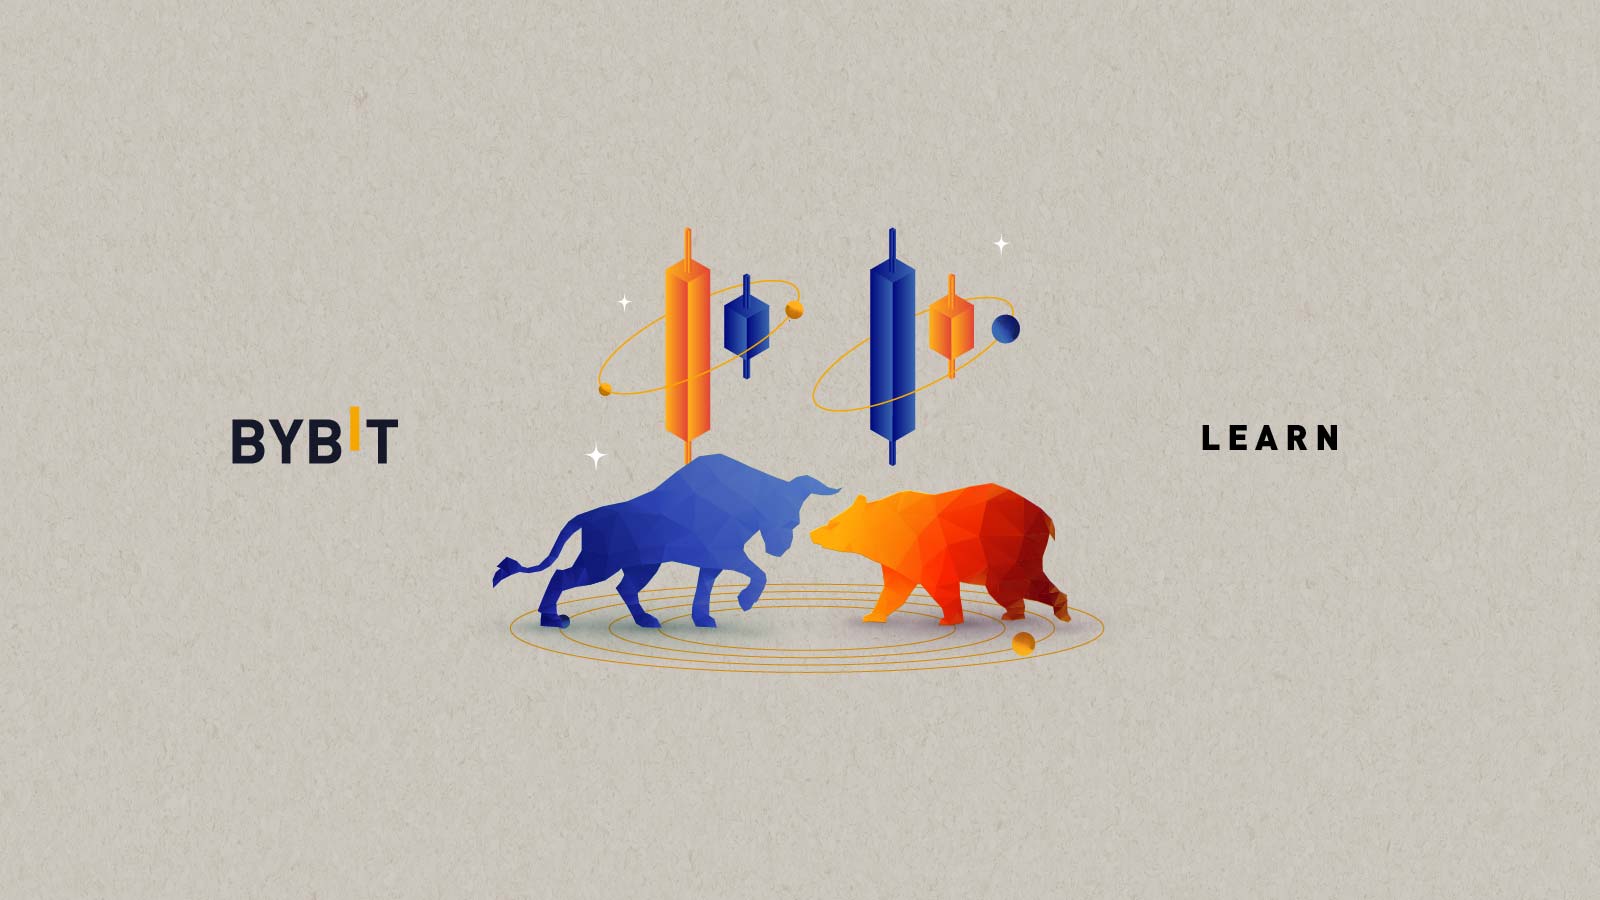
How to Use Bullish and Bearish Harami Candles to Find Trend Reversals
The Harami candlestick formation is used to signal traders a trend reversal is approaching. Not only is it easy to be spotted, but it also yields a good risk-to-reward ratio. Learn more.
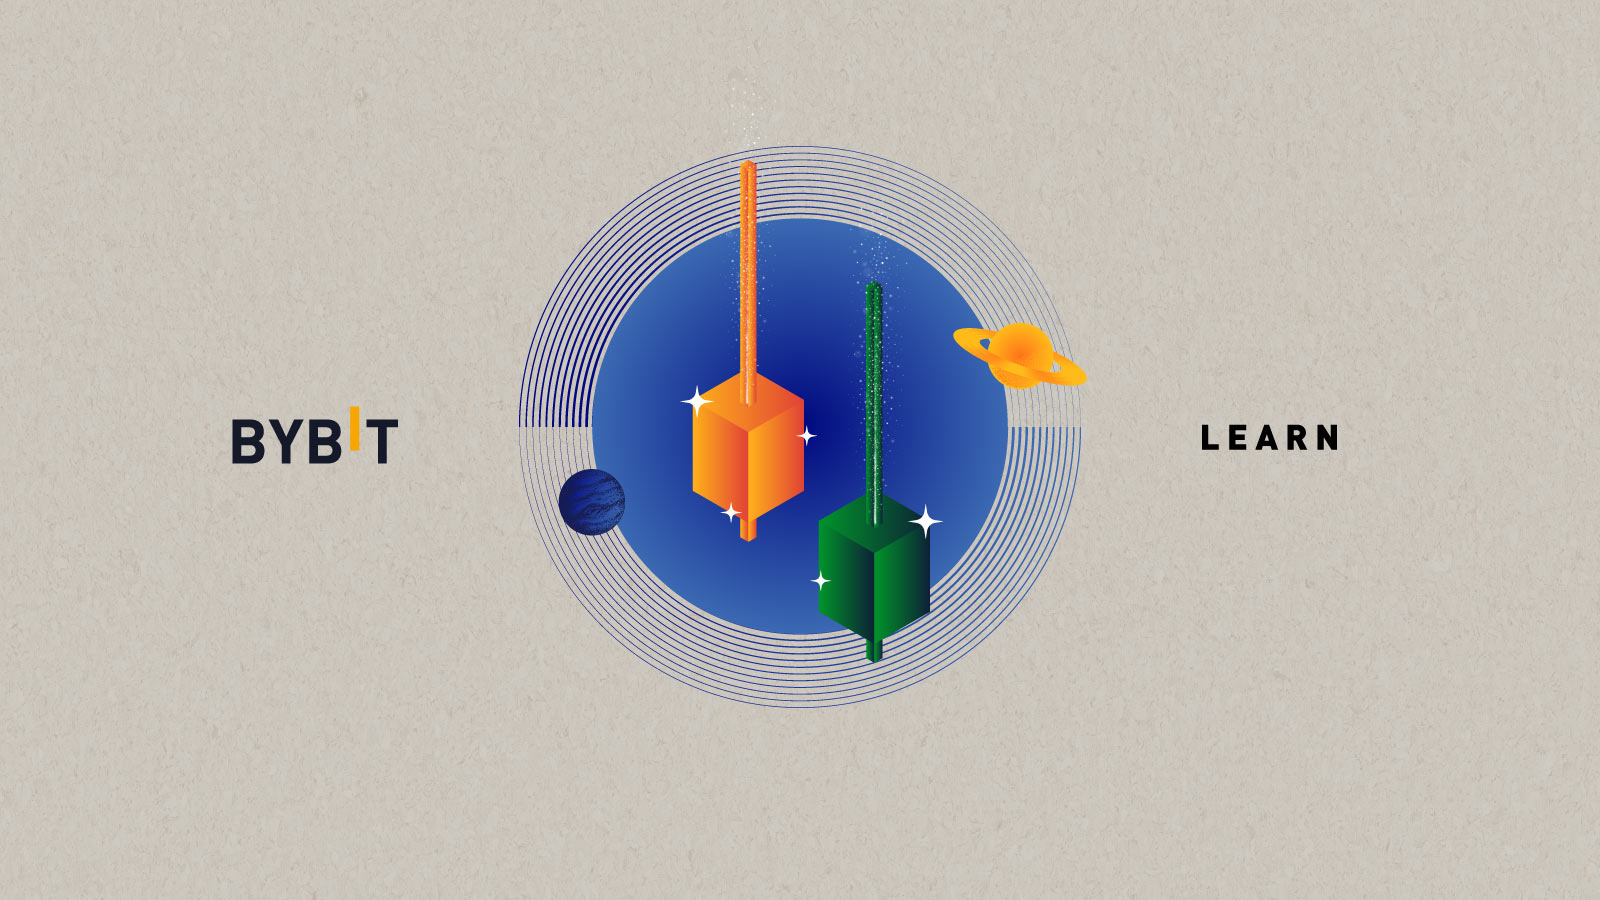
How to Use Shooting Star Candlestick Pattern to Find Trend Reversals
A shooting star is a bearish reversal candlestick pattern with an extended upper shadow with a little lower shadow. It appears to signal traders a trend reversal is coming. Learn how it works.
How to Use Three White Soldiers Pattern to Spot Bullish Reversal?
The three white soldiers is a bullish candlestick pattern that helps traders predict the upcoming trend reversal of a current downtrend. Read on to learn how it works & if it's reliable for technical analysis.
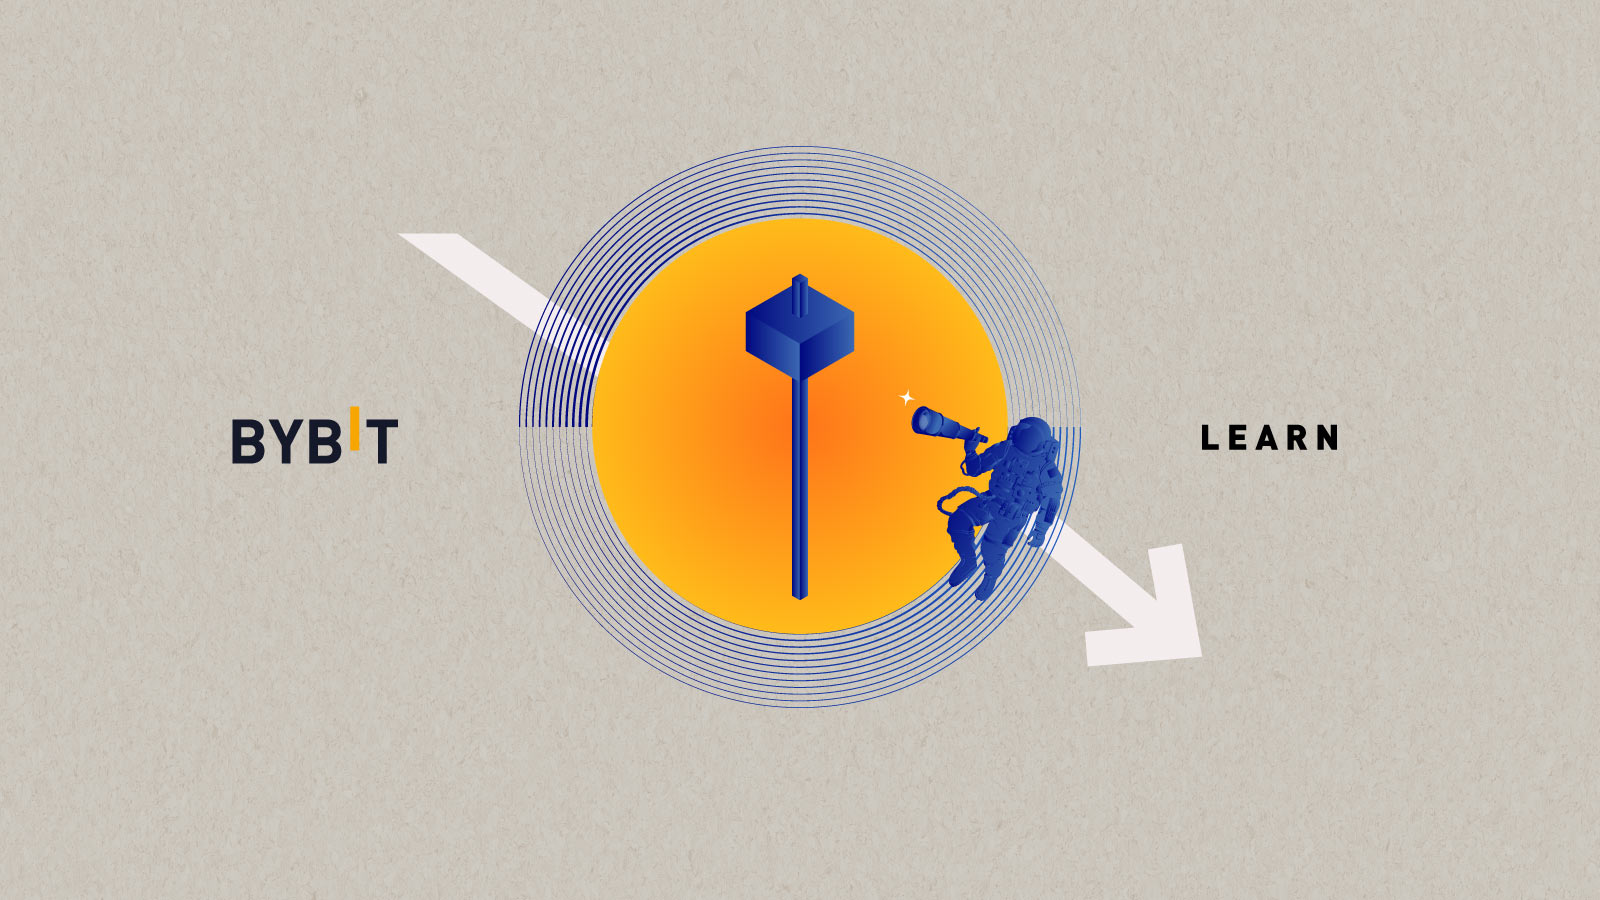
How to Use Hanging Man Candlestick Pattern to Trade Trend Reversal
The Hanging Man pattern is a bearish candlestick indicating the bull momentum is losing, signaling a trend reversal is approaching. Learn how to react when hanging man appears.
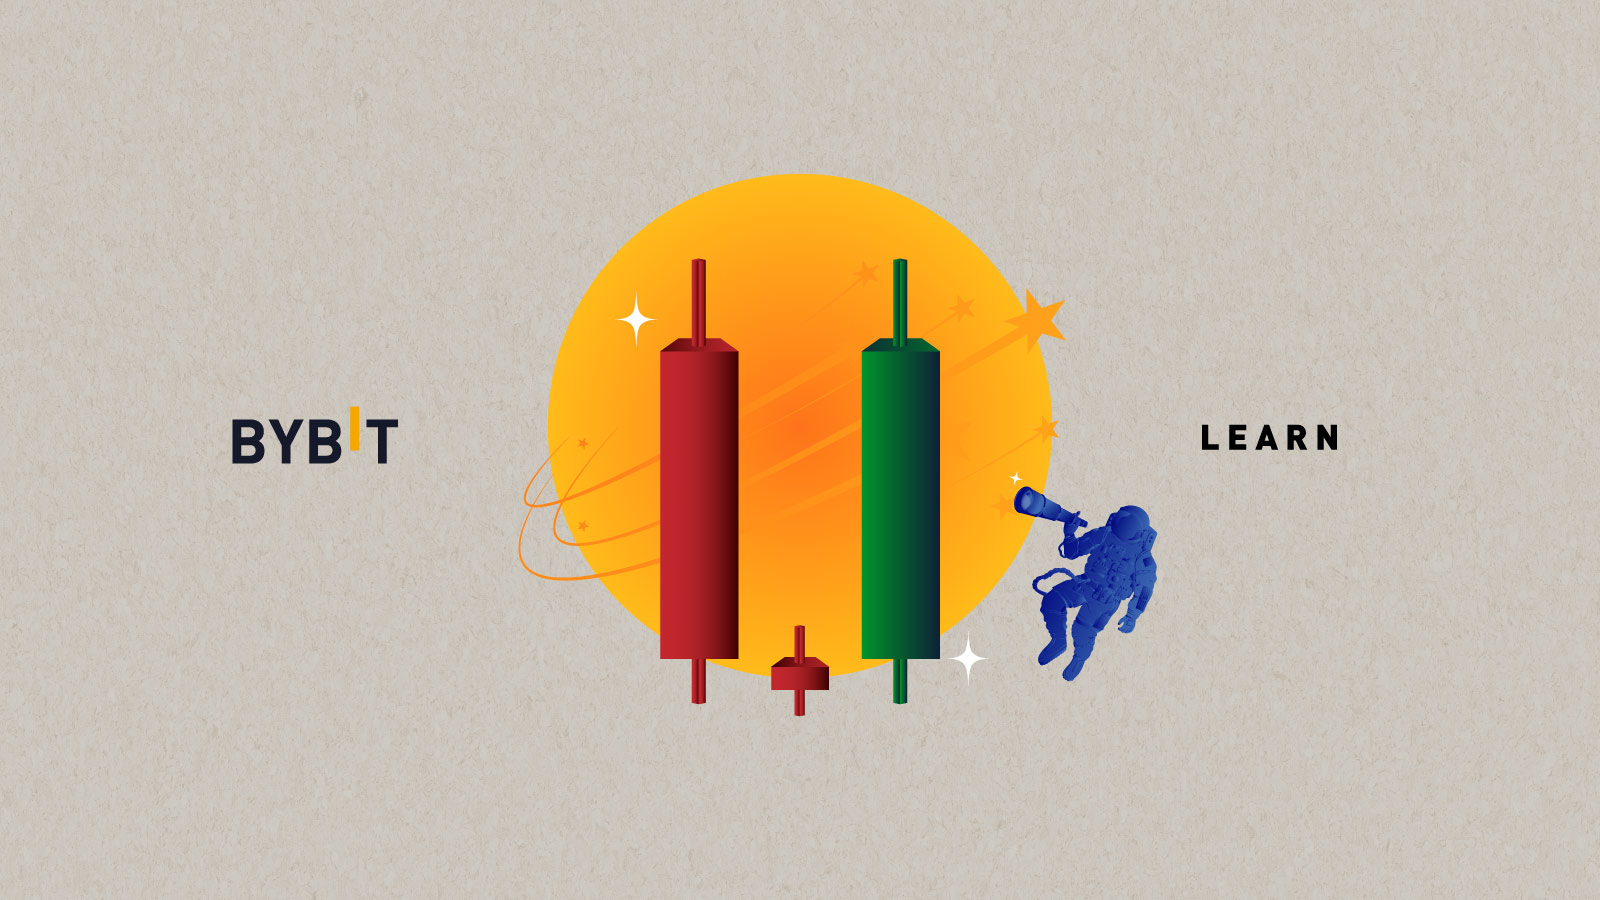
Morning Star Pattern: How to Identify a Bullish Reversal in Crypto
Morning star pattern is a bullish reversal pattern that tells you buyers are dominating the market. Thus, an uptrend is coming. But how to spot them? Learn more here.

How to Use Dark Cloud Cover Pattern to Trade Crypto
The dark cloud cover pattern tells traders that there is a potential correction ahead. But how to spot it & how reliable it is? Learn more.

What Is Telcoin? A Beginner’s Guide to Smarter Remittances
Telcoin (TEL) is a decentralized crypto built on the Ethereum blockchain. It help users send remittances via mobile platforms at a lower cost. Learn how it works.

What Is a Bear Flag Pattern? How to Use it to Trade Crypto Effectively
Bear flag patterns are an important warning sign for traders to spot. In this article, we'll explain how you can do just that.
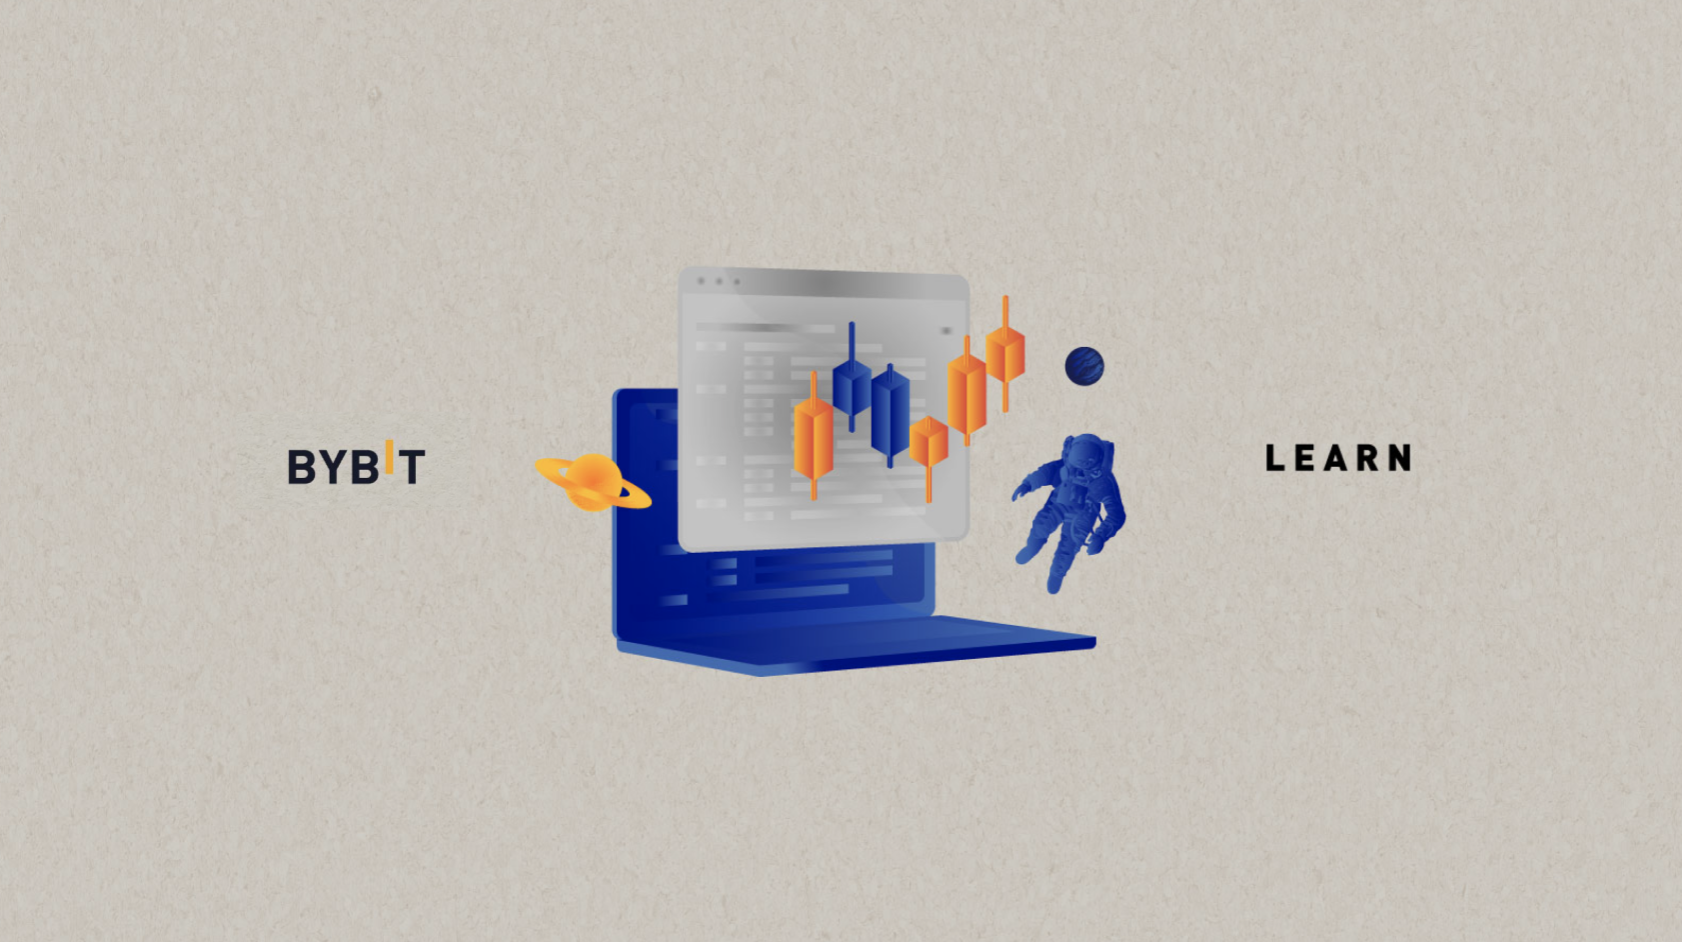
Continuation Patterns in Crypto Trading
Recently, another in the series of the Bybit Engage discussions took place in our Telegram group, and our Bybit Ambassador from
Learn to get up to 80 USDT prize
Master crypto concepts, trade and earn from your expertise.

Your crypto growth roadmap
View All
Explorer
Lv.0
Practitioner
Lv.1
Specialist
Lv.2
Strategist
Lv.3